
Where does the ‘energy transition’ end?
This post attempts to explain what happens when you take an electricity grid powered exclusively by gas turbines, and progressively add windfarms. Will you save money?
The answer is, ‘It depends’.
At least at first, it depends mostly on the gas price. You add the (very large) fixed capital and operating costs of a windfarm, but you save some fuel costs in the gas units. The capex and fixed opex of the gas units are not saved because you can’t close any power stations down, just in case the wind doesn’t blow.
This means:
If gas prices are low, it’s unlikely there will be a net saving, so every windfarm you add simply increases the overall cost of the system. Since demand is unchanged, unit costs (and therefore selling prices) have to increase.
If gas prices are high, however, you will indeed make a saving. In these circumstances, for every windfarm you add, the overall system cost goes down.
However, there is a catch on the second point. As you add more and more windfarms to the system, their average output starts to decrease. This is because, at first occasionally, and then more and more frequently, the total output of the windfarms will be higher than demand. Since that is never allowed on grids, the windfarms will have to be curtailed.
This is already happening on the UK grid, perhaps 2% of the time. In Germany, the figure is already close to 10%.
After this point is reached, each new windfarm effectively brings less output, but the same cost, to the system. Unit costs and selling prices therefore have to go up.
The figure below is the output of a simplified model of an electricity grid, showing this effect. The x-axis represents the proportion of wind capacity on the grid. On the left-hand side, the system is completely gas-fired, while on the right there is 2.5 times as much wind as gas capacity. The y-axis is the system cost per megawatt hour (the annualised capex, opex and fuel costs for wind and gas combined). The four curves represent different gas prices.
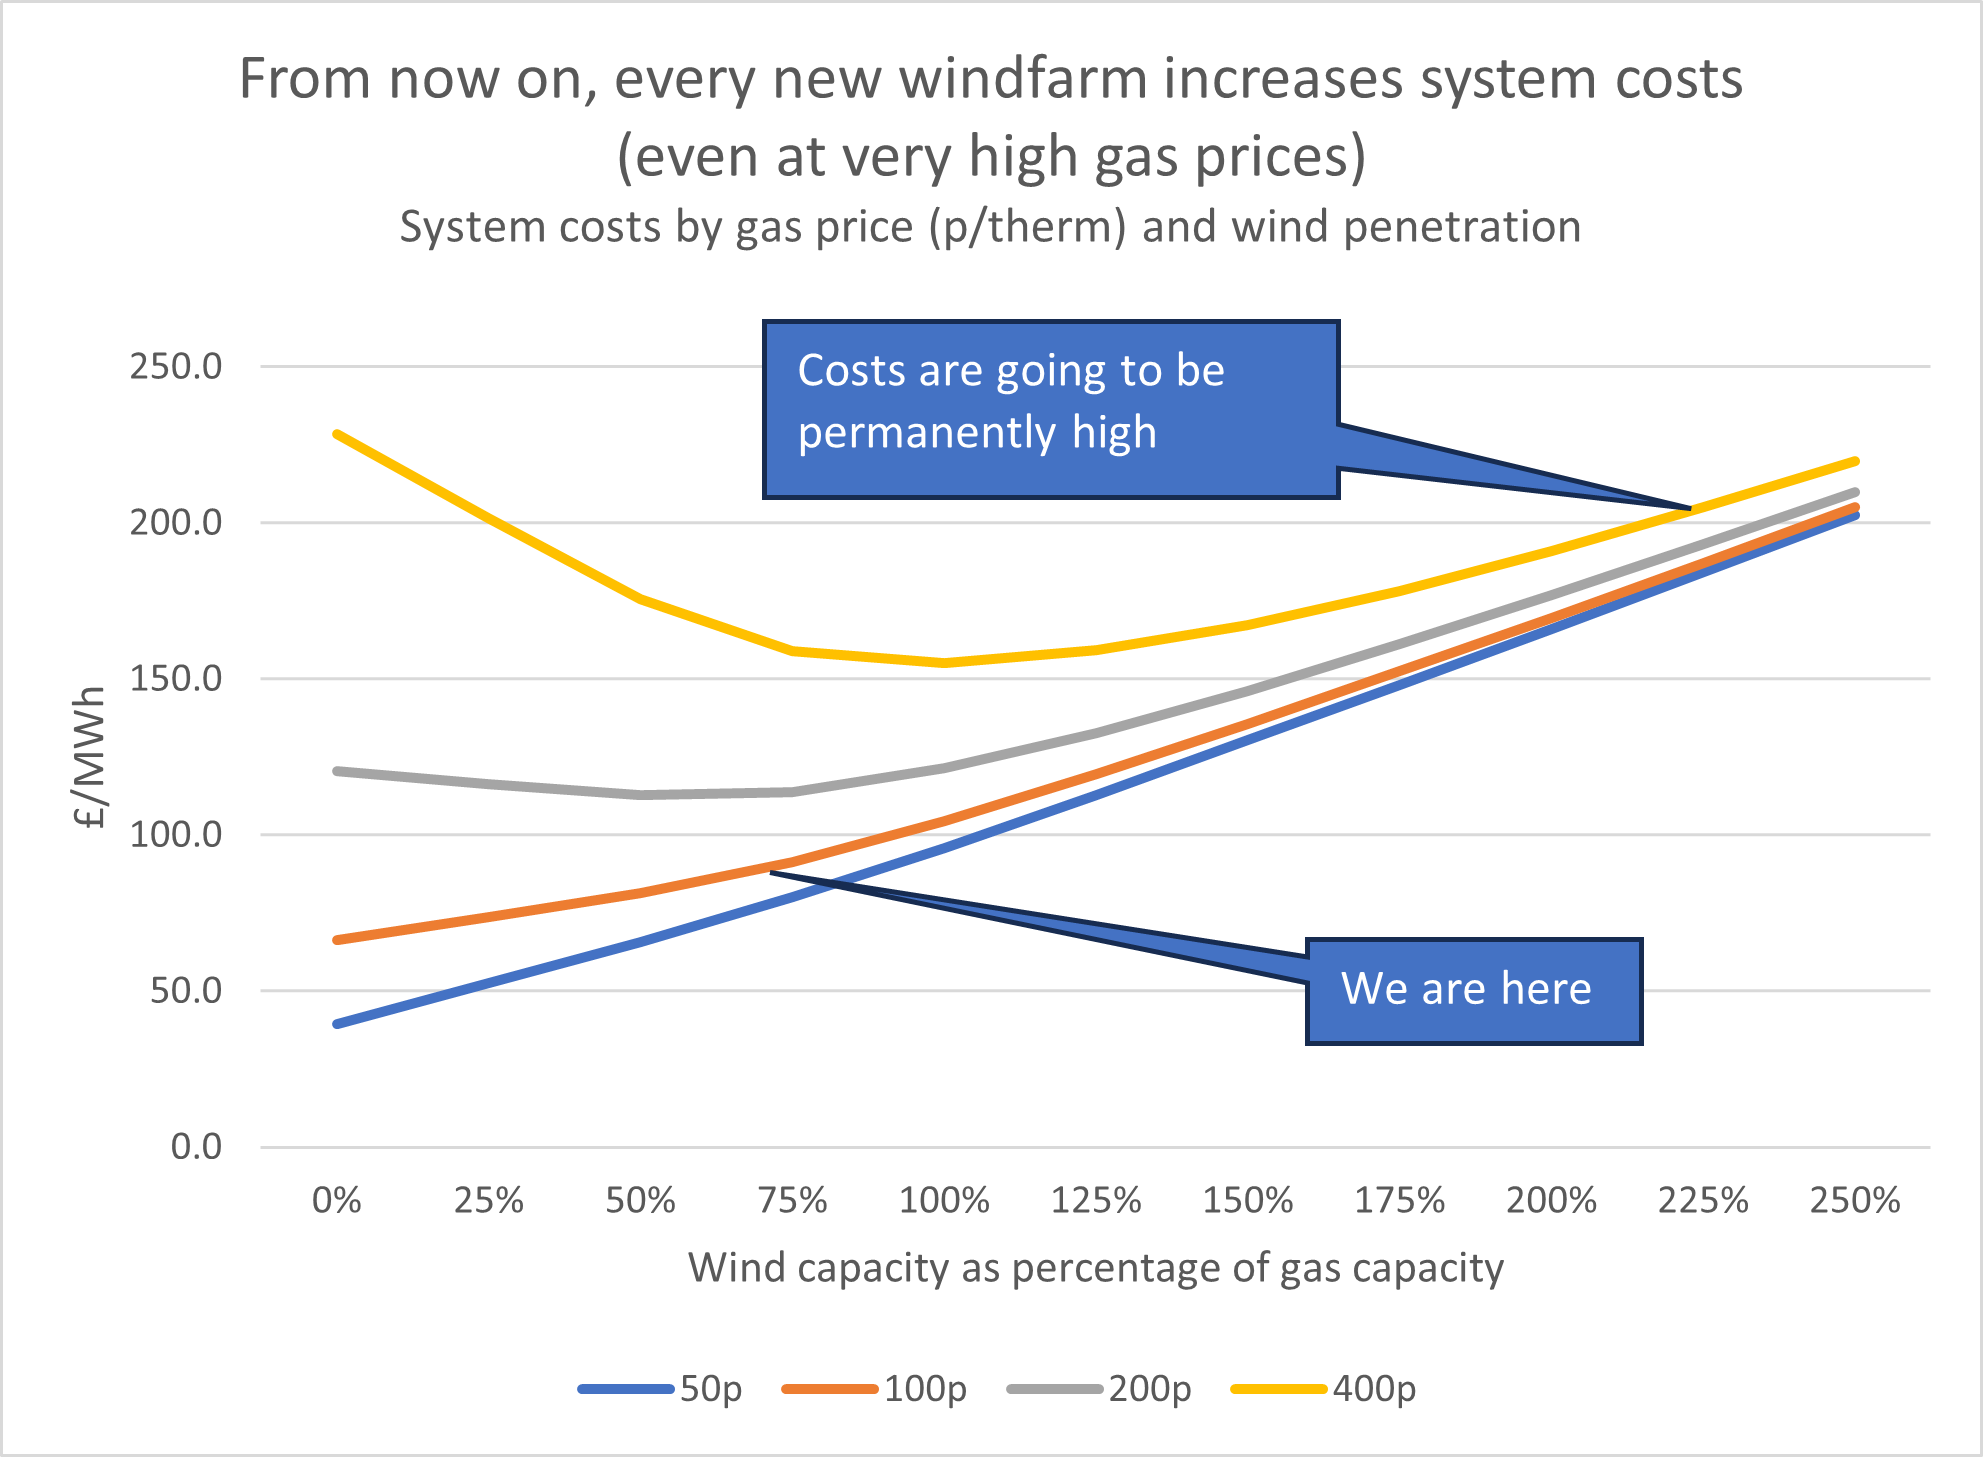
At low gas prices, as the first windfarm is added (at the left-hand side), the system cost increases. As further windfarms are added, the costs just go on rising. This is effectively the situation we have been in for most of the last 25 years. Current gas prices are around 100p/therm and, if they stay the same, we should expect electricity prices to increase steadily.
At the highest gas prices, the first windfarms cause system system costs to fall. But by the time the wind and gas capacities are equal – at 100% on the x-axis – that effect has petered out as curtailment of the windfarms increases. At this point, adding more wind capacity has a neutral effect on system costs. However, if you continue to add windfarms, more and more of it has to be constrained, and the unit costs start to rise.
At the start of this post, I said that the benefits (or disbenefits) of progressively adding windfarms to the grid depended on the gas price, at first. But in the end, when wind penetration is very high, the gas price is largely irrelevant because you are now in a situation where:
very little fuel is being burnt, so the system cost is mostly a function of the fixed capital and operating costs of the windfarms (plus to a lesser extent, of the gas-fired power stations).
any new wind capacity is to a large extent effectively curtailed, and does little to reduce fuel burn.
As a result, all four curves end up in roughly the same place, and increasing in linear fashion as more windfarms are added.
I’ve marked on the graph where we are today (although with the caveat that this is a much simplified model of the GB grid).