
The cost of Contracts for Difference
Introduction
Advocates of wind and solar electricity argue that Contracts for Difference (CfDs) are good value because they deliver green power at fixed prices, which protect us from volatility in the fossil fuel market. Critics argue that wind and solar CfDs are expensive relative to the alternatives, and that this reveals that the claimed cost reductions in these technologies under the Levelised Cost of Electricity (LCOE) metric are illusory when one takes into account a wider range of factors that cannot be avoided in reality. How should we judge the value of CfDs?
At one level, the CfD itself reveals whether it is costing or saving money. It guarantees a fixed value (the strike price) to the operator, regardless of market prices. If the market reference price is more than the strike price, the operator has to pay the difference to the Low Carbon Contracts Company (LCCC), which administers the scheme. This value is a net gain to electricity customers. If the market reference price is less than the strike price, the LCCC pays the operator the difference, so as to ensure it receives the strike price in the round. This value is then a net loss to electricity customers.
To date, strike prices have mostly been well above the market reference price. Consumers have had to contribute material sums to pay wind and solar operators their premium over the market value. However, for around a year from late 2021, when prices surged, the strike prices were below the market reference prices on average, and CfDs saved consumers some money.
Will CfDs save us money in future?
With the plans (of all incumbent parties, though Labour's are the ones that now count) to massively increase the amount of wind and solar on the grid, future costs are more important than the historic figures. Proponents claim that the costs of these technologies are still falling. The future costs of fossil fuels and other technologies (e.g. nuclear) are uncertain. So the past (as usual) is not necessarily a guide to the future. Perhaps CfDs will become a way, not only of delivering green electricity, but also of saving consumers money? That is a common claim, not only of eco-socialists, but also of so-called free-market environmentalists.
I don’t pretend to know. Cost trends are not endlessly linear, but neither is it easy to know when the discontinuity will occur. Those who claim to know that they won’t save consumers' money make the same mistake as those who claim to know that they will. We will find out in due course. But we can at least be clear how that judgment should be made.
How not to assess CfDs
The most egregious error is to compare CfD strike prices with LCOE projections. They are only projections and, moreover, LCOE does not pretend to cover the full range of costs (hence the development of more holistic but still backwards-looking metrics such as LFSCOE – Levelised Full-System Cost of Electricity). In the worst case, the comparison may even be made with the contract strike price rather than the current strike price (i.e. adjusted for inflation), which is materially higher.
If you see someone doing this, you can be sure they are a knave or a fool, and safely ignore them. If this were a valid approach, CfDs would have been saving consumers money much more often than they have in reality. The proof of the pudding is in the eating. Wind and solar have not been as cheap as LCOE indicated to date.
The value of electricity
The true comparison for the adjusted strike price is the value of electricity, in the shape of the market price. But what market price? In operation, there is no confusion: it is the market reference price, generated largely from the short-term (also known as ‘spot’ or ‘day-ahead’) prices on the exchanges. But there is no crystal ball to reveal these prices long-term to pundits, who nevertheless claim to be able to anticipate that these contracts will save or cost the consumer a lot of money. They have to rely on proxies that they hope reflect future market prices.
If they are honest enough to avoid LCOE, they are most likely to use a notional wholesale price, a price that reflects the average value of electricity to generators. This can be approximated in a number of ways.
The major electricity companies used to have to publish Consolidated Segmental Statements (CSSs – i.e. outline management accounts), which revealed their generating arms’ sales values and their supply arms’ purchase costs. Ofgem have failed dismally to get the big energy companies to publish these figures since 2022, a significant loss to market transparency. At last count (2021), the CSSs indicated (with wide variation) an average sales value to generators of £58/MWh and an average purchase cost to suppliers for the ‘fuel’ (i.e. electricity) of £73/MWh.
What we do still have is an indicative retail price via the Energy Price Cap, and a rough idea of the proportion of the retail price that is attributable to generation (as opposed to network, system, environmental etc) costs. That proportion has been falling with increase in the system costs as a result of decarbonisation efforts. Where once generation constituted nearly 60% of the retail price, it is now around 40% (and fell to 35% in 2020). So, for a very rough number, you could take 35–40% of the capped retail price as an indicative wholesale value. At current prices, that puts the notional wholesale value at around £78–89/MWh.
You can also take an average of the short-term prices on the exchanges, which pretty much equates to the market reference prices (which are published). The weakness is that most of our electricity is not traded on the exchanges. You would expect the exchanges to have marginally higher prices than the average for the market as a whole (because they are the fallback, when generators/suppliers have contracted too much/little).
These figures illustrate the volatility that proponents argue wind and solar can protect us from: under £40/MWh in 2020, rising to over £100/MWh in 2021, over £200/MWh in 2022, back down to £100/MWh in 2023, and currently running at around £70/MWh in 2024.
If the next round of CfDs are priced (in current money) at around £70/MWh, proponents will argue that they are costing us nothing, and insulating us against future price spikes. The former claim would not be true, even if wholesale prices held at around their current value.
The declining value of renewable electricity
The problem is that wind and solar are intermittent. Their variation is not distributed randomly against the spot prices. When the wind is blowing hard, prices are typically below average, as shown for different renewable technologies in the graphs below (click to enlarge).
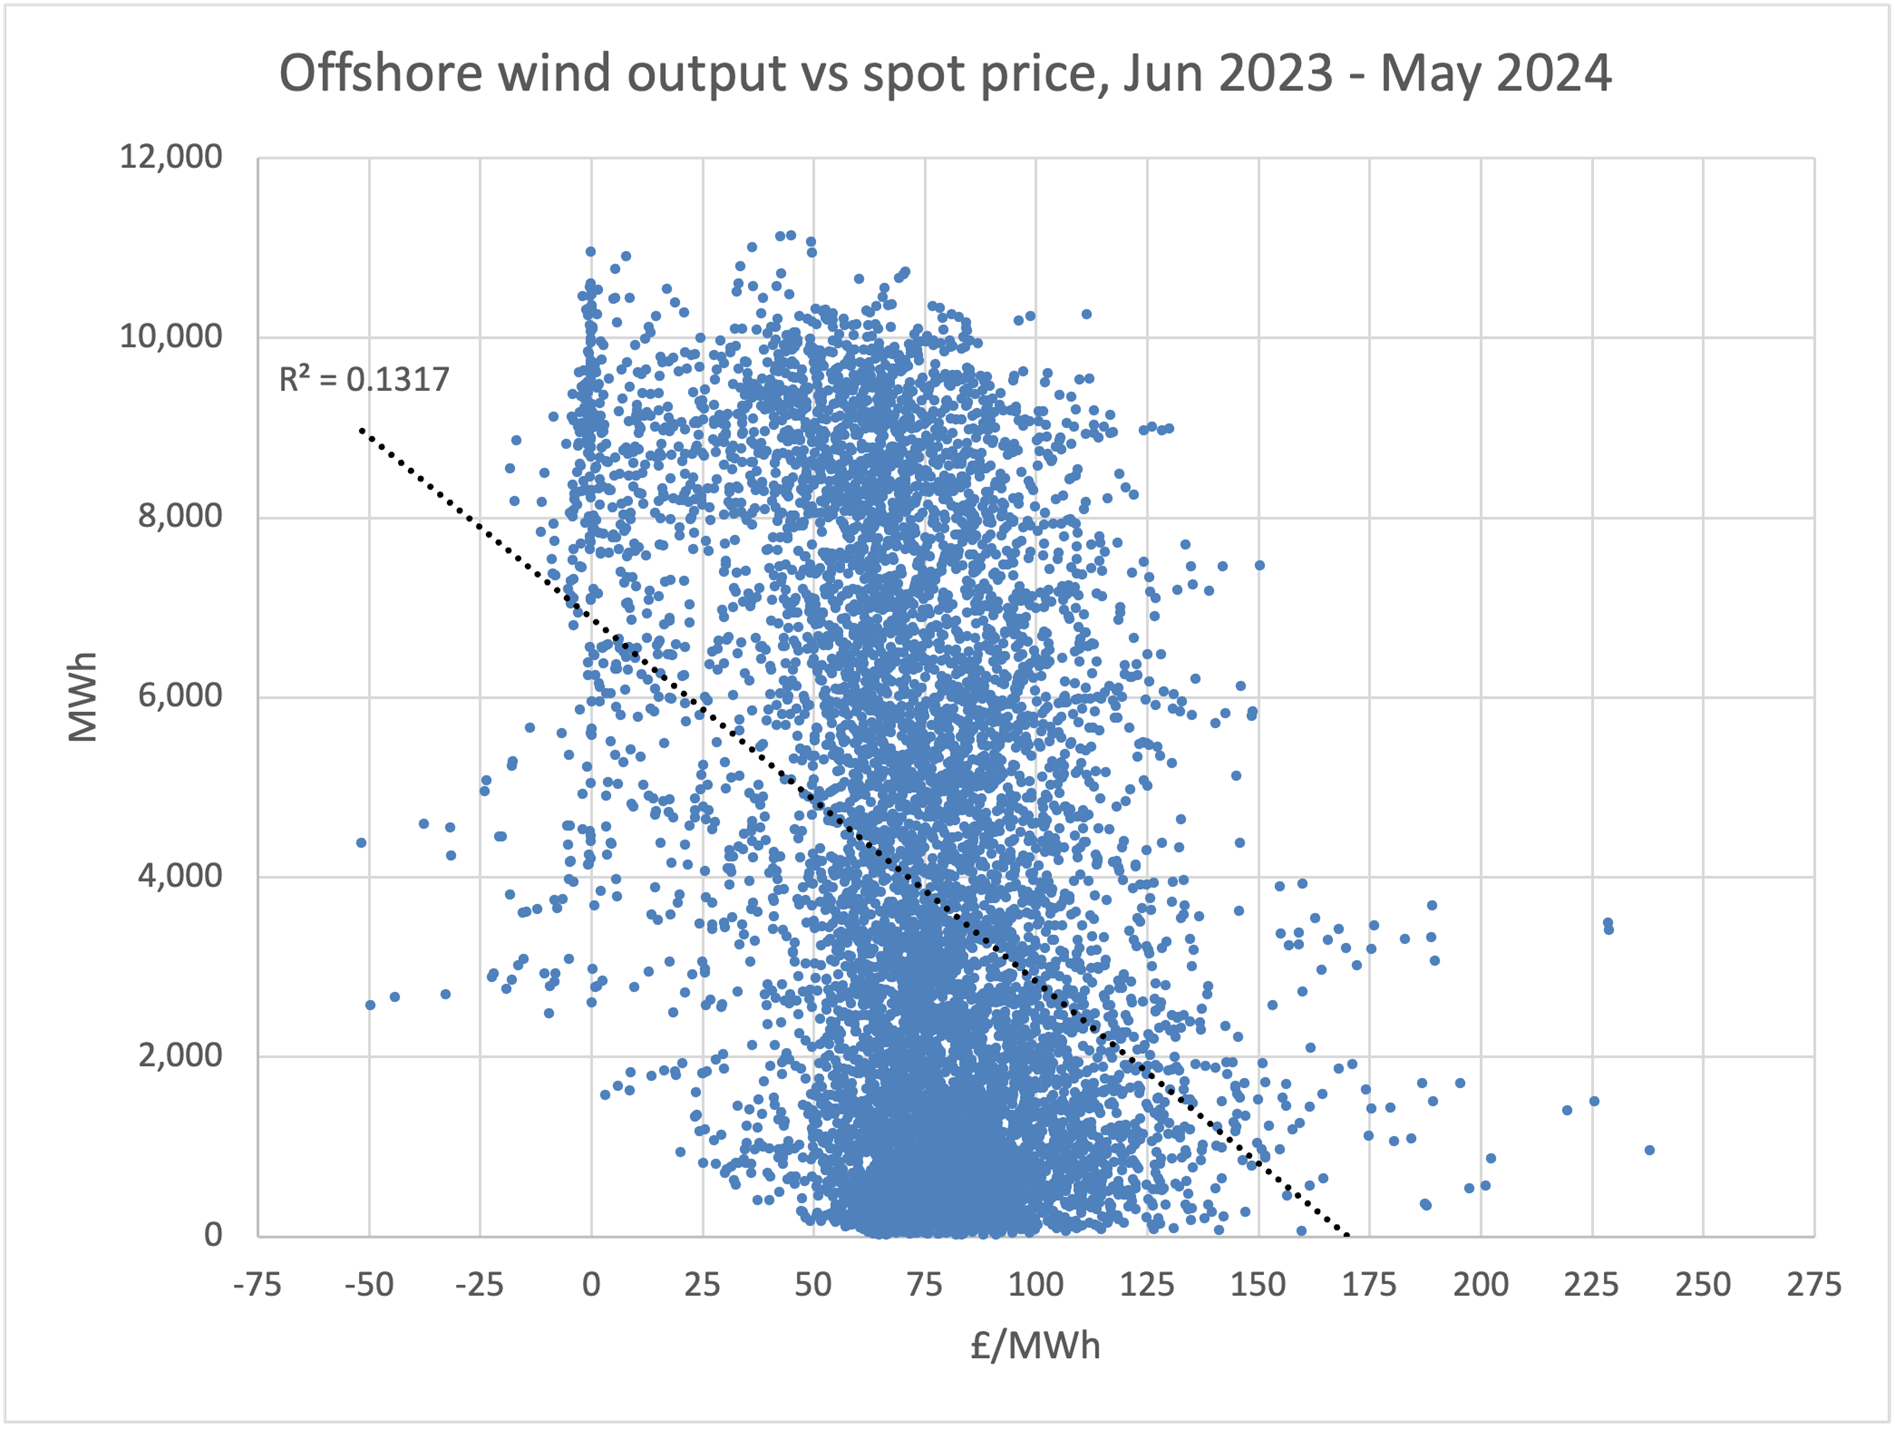


These show that when the wind is blowing hard, market prices – the value of the electricity produced – is lower than normal. The correlations are weak, but the effect is strong enough to be seen in the average prices achieved.[BP1] For example, if we take the year from June 2023 to May 2024, the mean Intermittent Market Reference Price (IMRP) was £73.92/MWh. Weighted to the output of onshore wind, however, that figure falls to £61.28/MWh. Weighted to offshore wind, the value is a bit closer, at £65.81/MWh. Solar has only a small negative correlation with the spot price, producing a weighted average of £69.82/MWh.
Consequently, all of these technologies would benefit from a CfD at £70/MWh, even though that is lower than the average wholesale price. In operation, this would mean that there would be a cost to consumers to support these CfDs, even though they appeared to be below the ‘market price’. Looked at another way, the CfD would prevent the benefit to consumers of overproduction by renewables generators being passed on in full.
What about the value of decarbonisation?
This is not the full picture, because comparing the cost of low-carbon generation with the mean wholesale price is implicitly setting the value of the avoided carbon at zero. Some readers will be comfortable with that, but I would not take that position. It is very unlikely that an insurance market large enough to underwrite the risk from climate change would value the liability at zero.
If we want to allow for some value for the decarbonisation within the CfD strike price, then we need to know how much carbon these projects are displacing. I am not going to go here into the issue of embodied carbon. The point I want to draw out here is that, like the wholesale price, the output from these technologies is not randomly distributed against the grid carbon emissions. When the wind is blowing, grid carbon intensity is typically low.
For the period June 2023 to May 2024, mean grid carbon intensity was 142 gCO2/kWh. If we weight that to the output from onshore wind, the figure falls to 116 gCO2/kWh. Offshore wind is barely different, at 118 gCO2/kWh. Solar is again less negatively correlated, giving a weighted average of 131 gCO2/kWh.


The appropriate price for carbon is hotly contested, although (ignoring outliers) the range (e.g. between Prof Nordhaus at the low end and Prof Stiglitz and Lord Stern at the high end) has been falling in recent years.
That is ironic, because, while the gap was closing, the UK government abandoned as hopeless any attempt to reduce it, and adopted a methodology that is much worse, to generate a ‘shadow carbon price’ with huge uncertainty bands, which no sane person would actually implement as a carbon price. For example, the 2024 price (in £2020, i.e. 18% higher in current money) is a central price of £256/tCO2e (tonne of carbon dioxide equivalent), with an uncertainty range from £128 to £384/tCO2e. By 2035, that increases to £302/tCO2e, within a range from £151 to £453/tCO2e. We can safely ignore these as absurd values, which would never be used directly, but which exist largely to give the government scope to justify anything they want.
£30 and £100 per tCO2e are towards the ends of the range produced by looking at the most credible studies. They would equate to the following values, given the weighted grid carbon intensities for wind and solar:
| Technology | Carbon cost (/tCO2) | |
| £30/t | £100/t | |
| (£/MWh) | (£/MWh) | |
|---|---|---|
| Onshore wind | 3.48 | 11.60 |
| Offshore wind | 3.66 | 11.80 |
| Solar | 3.93 | 13.10 |
Combining these figures with the weighted-average figures for the wholesale values of these technologies at recent prices, we get the following prices as the ballpark for cost neutral (including the climate externality) strike prices if a new round of CfDs were being priced in the near future:
| Technology | Cost range |
| (£/MWh) | |
|---|---|
| Onshore wind | 64.77–72.88 |
| Offshore wind | 69.47–77.61 |
| Solar | 73.75–82.92 |
These prices are in current £. If expressed as previous CfD rounds have expressed them, in 2012 £, the contract price would have to be much lower to equate to these current prices.
Strike prices above this range would arguably represent subsidy, unjustified by the carbon benefit. But one cannot state that with confidence, because these are relative to recent prices, and it is likely that future prices over the course of a CfD will not average the same as recent prices.
That is an innate problem with fixing a long-term price supposedly to ensure value, when the uncertainty on future values is so high that it is impossible to know if that price will turn out to represent good value. It would be better to allow the values at any moment to be discovered in the market, but that would prevent the government from passing the cost of that risk (known euphemistically as ‘de-risking’) from the big energy corporations to consumers.
What about other costs?
We have still not taken all the values into account. The extent to which Britain's increasing system, network and capacity-market costs can be attributed to the increasing intermittent capacity is another hotly disputed area. I am a maximalist in these regards. The increasing disparity in time and location between generation and demand seems to me the main cause of these costs. To my mind, the above figures are very generous to wind and solar, treating them as though they have no more responsibility than other technologies for the large increase in network, system, and capacity-market costs.
Whatever the underlying wholesale value, one thing we can say with confidence is that the above problems with the weighted averages will only get worse as we install more intermittent capacity. There will be more over-supply when the wind is blowing or the sun is shining, leading to lower prices when they are generating. And the grid carbon intensity at those times will tend towards zero, as the excess intermittent capacity reduces the output from fossil-fired generators when it is windy or sunny to whatever spinning reserve remains. Well before we reach the planned capacity, the carbon value of extra wind or solar generation will be very low.
It is against this background that we see the big energy corporations and lobby groups for the green-industrial complex petitioning our new government for increased funding for the CfDs. To the extent that it reflects increased ambition, that is the responsibility of the political decision, not the technology cost. But to the extent that it is also hoped to support higher strike prices (and this does seem to be a common demand recently), it raises serious doubts over the claims of falling costs, system benefits and good value. Only if we think the prices of 2021–23 will return persistently can higher strike prices represent good value. It would be better if investors had to take that risk, not consumers.
Note on the data
The sources of the data are:
For the half-hourly output from onshore and offshore wind and solar: Elexon, Balancing Mechanism Reporting Service (BMRS), Actual or Estimated Wind and Solar Power, https://bmrs.elexon.co.uk/actual-or-estimated-wind-and-solar-power-generation
For the market reference prices: Low Carbon Contracts Company, IMRP Actuals, https://dp.lowcarboncontracts.uk/dataset/imrp-actuals
For the grid carbon intensity: The Carbon Intensity API, https://carbonintensity.org.uk/
For the government's carbon valuation methodology and shadow prices: BEIS/DESNZ, Valuation of greenhouse gas emissions: for policy appraisal and evaluation, https://www.gov.uk/government/publications/valuing-greenhouse-gas-emissions-in-policy-appraisal/valuation-of-greenhouse-gas-emissions-for-policy-appraisal-and-evaluation
For Nordhaus, Stiglitz and Stern's updates to their earlier estimations on the social cost of carbon:
William D Nordhaus, "Revisiting the social cost of carbon", Proceedings of the National Academy of Sciences (PNAS) 114 (7) 1518-1523, Jan 2017, https://doi.org/10.1073/pnas.1609244114
Carbon Pricing Leadership Coalition, Report of the High Level Commission on Carbon Prices (2017), https://www.carbonpricingleadership.org/report-of-the-highlevel-commission-on-carbon-prices
The large Energy Companies' Consolidated Segmental Statements are listed by Ofgem at https://www.ofgem.gov.uk/publications/energy-companies-consolidated-segmental-statements-css
Data accuracy
There has been a persistent problem with Elexon's data for wind output. To take the latest data at time of writing as an example:

It is extremely unlikely that wind output jumps about like this at (mostly) half-hour intervals. The offshore wind (purple line) at the start of that period is jumping from around 150 MW in one period to around 1,500 MW in the next and then. back down to 150 MW, and so on. The onshore wind (blue line) variation here is less outlandish. Nevertheless, in the middle of that period, it is (approximately) halving and doubling from one period to the next.
Elexon should in general be praised for the extent to which they support data transparency in the British electricity market. But I have never seen a satisfactory explanation from them for this phenomenon, let alone a proposal to fix it. It is a dramatic example of a wider problem they have with occasional holes in most of their data sets.
My assumption is that this must be faulty data. To the eye, it looks like the peaks reflect the true figures and the troughs reflect missing data or erroneous recording.
This degree of variation would have a serious impact on any attempt to assess these curves' correlation with other data sets. Pending a more precise resolution by Elexon of this problem with their data, I have used a 6-hour rolling average to remove the peaks and troughs, on the basis that it is a short enough period not to move the curve much, but a large enough number of data points for each average value to correct for all but the largest of data errors.
The reader is welcome to try different techniques to test whether it changes the relationships significantly. I do not expect any reasonable technique would. The best solution would be for Elexon to correct its data, or perhaps (for Elexon to confirm) for the wind generators to submit more accurate data.